APPLIED FIELD WORK
Qualitative Data:
Qualitative data is data which is descriptive and is harder to analyse and which gives your opinions. e.g Shape of the pebble.
Quantitative Data:
Quantitative data is information about quantities; that is, information that can be measured and written down in the form of numbers. e.g The angle of the beach slope.
Primary Data:
Primary data is what you collect specifically for research towards your project and data that you have collected first hand. e.g Measuring the angle of the beach slope.
Secondary Data:
Secondary data is data collected by someone other than the user. e.g Finding information using a map.
Random Data:
Random data is collected using a random number generator to determine the intervals of measurement.
Stratified Data:
Stratified data is collected following a strategic approach. e.g Measuring the beach twice between every groyne.
Systematic Data:
Systematic data is collected following a systematic approach. e.g Measuring the slope every 3 meters.
How is data collected?
Random data may be using a random number generator to get a number and then whatever number that comes up you use that. For example asking the 13th person what they think of how tidy the beach is. Stratified data is a consistent data collection, like every 5 meters. Systematic data would be using a system to get data, for example asking 50% men and 50% women.
Transect:
A transect is a straight line or narrow section through an object or natural feature or across the earth's surface, along which observations are made or measurements taken.
Field Trip to Highcliffe beach
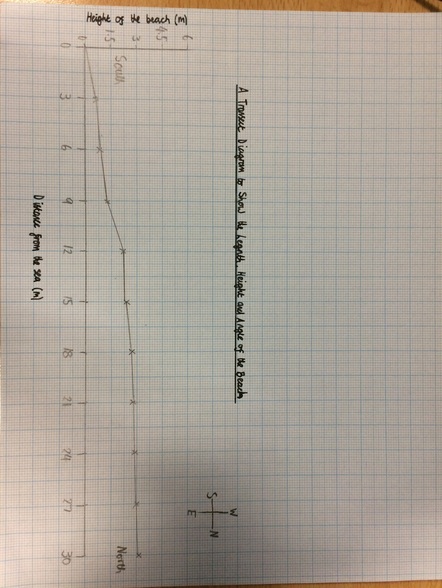
On our field trip to Highcliffe beach we were given several tasks and ways to complete them. We had to measure the angle of the slope of the beach from sea to path, we did this by measuring every three meters and placing a meter rule in the sand at each 3 meter interval, we used a gun clinometer to measure each angle.
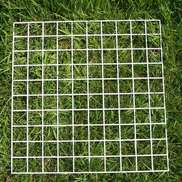
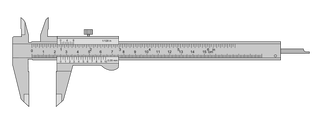
Next we had to measure the height, width and depth of 3 different pebbles in each 3 meter intervals, we used a caliper and a quadrat to do this. We placed the quadrat down at each interval and measured 3 pebbles, one in the top, one in the middle and one from the bottom of the quadrat, then we measured it using the caliper. We used the scale of millimeters to make sure it was accurate.
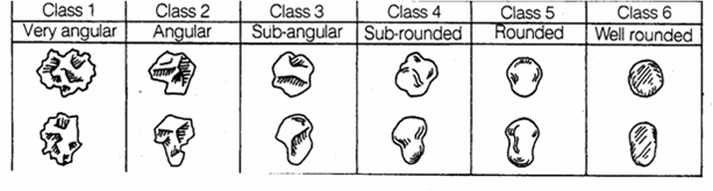
Then we used the Powers chart to judge what class the pebbles came under, and the shapes of the pebbles for example the angles and roundness of them.
My data is quite accurate because we measured in millimeters rather than centimeters which suits our task better as the pebbles are not exact centimeters and the scale for millimeters is lower and therefore more accurate. We used the same person measure using the caliper and measuring the angles with the gun clinometer so this would make our readings more accurate. Choosing which class the pebbles come under is judgement which is different per person so that could lower the accuracy of my results.
Null Hypothesis:
Our hypothesis is that the longshore drift does not move from west to east.
We disproved this because on the West the beach is higher and the East has been starved of sand and shingle due to the groyne holding it in place. This proves that longshore drift goes from West to East, however the groynes prevented long shore drift from taking place.
Qualitative data is data which is descriptive and is harder to analyse and which gives your opinions. e.g Shape of the pebble.
Quantitative Data:
Quantitative data is information about quantities; that is, information that can be measured and written down in the form of numbers. e.g The angle of the beach slope.
Primary Data:
Primary data is what you collect specifically for research towards your project and data that you have collected first hand. e.g Measuring the angle of the beach slope.
Secondary Data:
Secondary data is data collected by someone other than the user. e.g Finding information using a map.
Random Data:
Random data is collected using a random number generator to determine the intervals of measurement.
Stratified Data:
Stratified data is collected following a strategic approach. e.g Measuring the beach twice between every groyne.
Systematic Data:
Systematic data is collected following a systematic approach. e.g Measuring the slope every 3 meters.
How is data collected?
Random data may be using a random number generator to get a number and then whatever number that comes up you use that. For example asking the 13th person what they think of how tidy the beach is. Stratified data is a consistent data collection, like every 5 meters. Systematic data would be using a system to get data, for example asking 50% men and 50% women.
Transect:
A transect is a straight line or narrow section through an object or natural feature or across the earth's surface, along which observations are made or measurements taken.
Field Trip to Highcliffe beach
On our field trip to Highcliffe beach we were given several tasks and ways to complete them. We had to measure the angle of the slope of the beach from sea to path, we did this by measuring every three meters and placing a meter rule in the sand at each 3 meter interval, we used a gun clinometer to measure each angle.
Next we had to measure the height, width and depth of 3 different pebbles in each 3 meter intervals, we used a caliper and a quadrat to do this. We placed the quadrat down at each interval and measured 3 pebbles, one in the top, one in the middle and one from the bottom of the quadrat, then we measured it using the caliper. We used the scale of millimeters to make sure it was accurate.
Then we used the Powers chart to judge what class the pebbles came under, and the shapes of the pebbles for example the angles and roundness of them.
My data is quite accurate because we measured in millimeters rather than centimeters which suits our task better as the pebbles are not exact centimeters and the scale for millimeters is lower and therefore more accurate. We used the same person measure using the caliper and measuring the angles with the gun clinometer so this would make our readings more accurate. Choosing which class the pebbles come under is judgement which is different per person so that could lower the accuracy of my results.
Null Hypothesis:
Our hypothesis is that the longshore drift does not move from west to east.
We disproved this because on the West the beach is higher and the East has been starved of sand and shingle due to the groyne holding it in place. This proves that longshore drift goes from West to East, however the groynes prevented long shore drift from taking place.
|

|
|